Core Metrics
The Dashboard provides a high-level view of the health, security, and activity of your Organization. It is designed to give you quick insight into what is happening across your devices without requiring deep technical investigation.
This document explains the core metrics shown on the Dashboard, including the top-level summary metrics and the Protection & Maintenance Snapshot. Together, these sections help you understand both the current state of your environment and the work that has been completed behind the scenes.
Top-Level Metrics
The top row of the Dashboard displays five key metrics. These are intended to give you an at-a-glance summary of your environment.

- Devices shows the total number of active devices currently enrolled in your Organization. This includes all workstations and servers that are reporting to the platform.
- Healthy Devices indicates how many devices are currently in a healthy state. A healthy device is one that is online, reporting correctly, and does not have outstanding issues requiring attention.
- Alerts represents the number of active alerts across all devices. Alerts typically indicate issues such as failed tasks, devices that are offline, or conditions that may need review.
- Active Threats shows the number of confirmed security threats that are currently active and unresolved. A value of zero indicates that no known threats are present at this time.
- Pending OS Patches displays the number of operating system updates that are available but not yet installed across your devices.
These metrics are updated automatically as devices report in and tasks are completed.
Protection & Maintenance Snapshot
The Protection & Maintenance Snapshot provides visibility into the work being performed by the system over time. This section focuses on completed actions rather than current status, helping demonstrate ongoing maintenance and protection activity.
All data in this section is grouped into three time ranges: the previous day, the last 7 days, and the last 30 days. Dates are displayed using UTC.
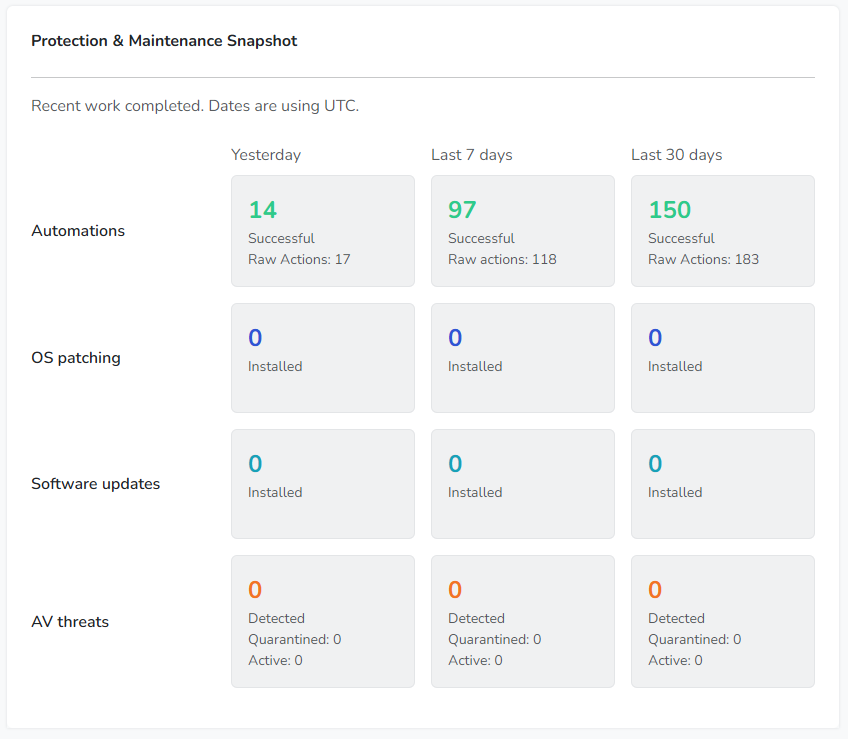
Automations
Automations represent background tasks that are executed automatically by the system. These tasks include routine maintenance, monitoring checks, and other automated actions required to keep devices protected and functioning properly.
For each time range, the Dashboard shows the number of successful automations, along with the total number of raw actions performed. This provides insight into both reliability and activity volume.
OS Patching
The OS Patching section shows how many operating system updates have been successfully installed during each time period.
These updates are applied automatically according to defined policies, helping ensure that devices remain protected against known vulnerabilities without requiring manual intervention.
Software Updates
Software Updates track the installation of updates for supported third-party applications.
Keeping software up to date reduces exposure to security issues and improves stability. This section shows how many updates have been applied during each reporting window.
AV Threats
AV Threats reflect security-related events detected by antivirus and next-generation antivirus tools.
This section provides visibility into how many threats were detected and handled during each time range, offering insight into ongoing security activity even when no active threats remain.
Backups
The Backups section shows completed backup operations for protected devices.
These metrics help confirm that data protection processes are running as expected and that backups are being completed consistently over time.
Together, the Dashboard metrics are designed to provide confidence and transparency. They allow you to quickly confirm that devices are protected, maintenance is occurring, and security activity is being handled automatically in the background.