Network At-A-Glance
The Network-at-a-glance section provides a concise visual overview of device health across your Organization. This view is designed to help you quickly understand the current state of your network without needing to review individual devices one by one.
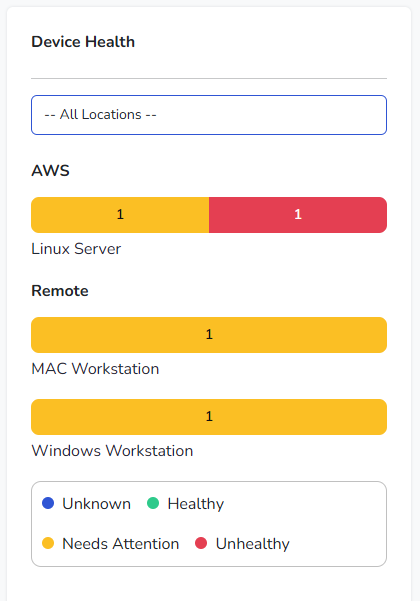
On the Dashboard, this section appears as Device Health and summarizes device status by location and device type using simple, color-coded charts.
Locations
Devices can be grouped by Location, such as physical offices, cloud environments, or logical groupings like remote users. In the example shown, locations such as AWS and Remote are used to distinguish where devices are operating.
The location selector at the top of the section allows you to filter the view. Selecting All Locations shows devices across the entire Organization, while selecting a specific location limits the view to only those devices.
Device Types
Within each location, devices are grouped by type, such as Linux servers, macOS workstations, or Windows workstations. Each device type is displayed as a horizontal bar chart.
These charts provide a breakdown of device status within that group, making it easy to see whether systems are healthy or need attention.
Status Indicators
Each bar is divided into colored segments representing device status:
- Healthy indicates devices that are online, reporting correctly, and have no outstanding issues.
- Needs Attention indicates devices with non-critical issues or alerts that may require review.
- Unhealthy indicates devices with significant issues that should be addressed.
- Unknown indicates devices that are not currently reporting or whose status cannot be determined.
A legend below the charts clearly identifies which color corresponds to each status.
Interactive Details
Hovering over a colored segment within a chart displays a tooltip showing the number of devices in that status. This allows you to quickly confirm how many devices are healthy or need attention without leaving the Dashboard. Clicking on any of the colored sections will take you to the Devices page, filtered on the type of device you were hovering over when you clicked.
This visual summary makes it easy to spot patterns, such as a location with multiple devices needing attention or a specific device type experiencing issues.
The Network-at-a-glance view is intended to provide fast insight and reassurance, helping you understand the overall health of your environment at a glance while still allowing deeper investigation when needed.